Milestone Chart in Project Management: A Complete Guide | Learnerskart
-
December 15, 2025
Effective project management depends on clear planning, transparent communication, and timely tracking. Among the many tools used by project managers, one of the simplest yet most powerful is the Milestone Chart. It provides a high-level overview of major project events, helping teams stay aligned and stakeholders stay informed.
In this guide, we’ll break down what a milestone chart is, why it matters, how it differs from a Gantt chart, and how you can create one for your next project.
What Is a Milestone in Project Management?
A milestone is a significant event or achievement within a project. It marks the completion of a major phase, decision point, approval stage, or key deliverable. Milestones do not have durations; instead, they act as checkpoints to measure progress.
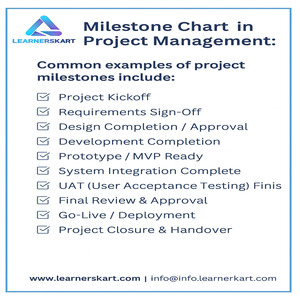
Common examples of project milestones include:
-
Project kickoff
-
Requirements sign-off
-
Design approval
-
Prototype completion
-
System integration
-
UAT completion
-
Go-live or project closure
Milestones help teams and stakeholders understand where the project stands at any given moment.
What Is a Milestone Chart?
A Milestone Chart is a timeline-based visual tool that highlights the key milestones of a project in chronological order. Unlike detailed schedules overloaded with tasks and subtasks, a milestone chart focuses only on the essential checkpoints that define project progress.
A typical milestone chart includes:
-
Milestone name
-
Planned date
-
Actual completion date
-
Sequence on a timeline
-
Colour-coded status (optional)
It offers a clean, high-level snapshot that anyone can understand within seconds — ideal for presentations, reporting, and stakeholder communication.
Why Milestone Charts Matter in Project Management
1. Simplifies Complex Schedules
Large projects often include hundreds of tasks. A milestone chart cuts through the noise by highlighting only the major achievements that matter.
2. Improves Stakeholder Communication
Executives and clients prefer milestone-level updates. These charts deliver clear progress insights without overwhelming detail.
3. Helps Track Progress Efficiently
Each milestone becomes a checkpoint to confirm whether the project is on schedule. Delayed milestones signal the need for corrective action.
4. Identifies Risks Early
If a milestone slips, it immediately indicates potential schedule concerns. This allows the project manager to take timely action.
5. Enhances Project Planning
By defining milestones, teams gain clarity on deliverables and can plan phases more effectively.
Milestone Chart vs Gantt Chart
Although both tools are used in project planning, they serve different purposes.
| Feature | Milestone Chart | Gantt Chart |
|---|---|---|
| Focus | Key events & checkpoints | Detailed tasks & timelines |
| Detail level | High-level | Comprehensive |
| Duration | No duration | Includes duration and dependencies |
| Best for | Reporting & communication | Day-to-day project execution |
| Audience | Leadership & stakeholders | Project teams |
For executives and clients, a milestone chart is easier to understand. For internal teams, a Gantt chart is more useful for task management.
When Should You Use a Milestone Chart?
Milestone charts are ideal when you need to:
-
Present high-level project schedules
-
Track progress across multiple phases
-
Communicate with senior management
-
Manage large, complex projects
-
Create quick project snapshots for presentations
-
Document key achievements for PMP studies or audits
Industries that commonly use milestone charts include:
-
IT & Software Development
-
Construction
-
Engineering
-
Product Development
-
Manufacturing
-
Marketing Campaigns
-
Government Projects
How to Create a Milestone Chart (Step-by-Step Guide)
Step 1: Identify Key Milestones
List the most important project checkpoints — only those that represent significant progress.
Step 2: Arrange Them in Sequence
Organize your milestones in the order they are expected to occur.
Step 3: Assign Target Dates
Specify when each milestone should be completed.
Step 4: Build the Timeline
You can use tools like:
-
Excel
-
PowerPoint
-
MS Project
-
Jira
-
Wrike
-
Asana
-
ClickUp
Plot the milestones on a horizontal timeline.
Step 5: Add Status Indicators
Mark milestones as:
-
Planned
-
Completed
-
Delayed
-
At risk
Colour-coding can improve clarity.
Step 6: Share and Review
Present the chart to stakeholders and review it regularly throughout the project lifecycle.
Example of a Milestone Chart
Here’s a simple example of a software development project:
| Milestone | Planned Date | Status |
|---|---|---|
| Requirements Finalized | Jan 15, 2025 | Completed |
| Design Approved | Feb 10, 2025 | Completed |
| Development Completed | Apr 30, 2025 | In Progress |
| UAT Completed | Jun 15, 2025 | Planned |
| Go-Live | Jul 1, 2025 | Planned |
This provides a clear picture of progress without overwhelming stakeholders.
Benefits of Using Milestone Charts
-
Clear visibility across all project phases
-
Better reporting and communication
-
Faster decision-making
-
Increased accountability
-
Enhanced risk management
-
Improved alignment between teams and stakeholders
Conclusion
A Milestone Chart is one of the most effective tools for simplifying project tracking and improving communication. By highlighting the major events and achievements in the project lifecycle, it helps project managers stay in control and ensures stakeholders always understand the status and direction of the project.
Whether you’re managing complex initiatives or preparing for the PMP exam, mastering milestone charts is essential for successful project delivery.
📞 Learnerskart – Contact Details
For professional PMP Training, Project Management Courses, and Certification Support, connect with us:
🌐 Visit: www.learnerskart.com | 📧 Email: info@learnerskart.com
✔️ Follow us for more project management tips & career insights! https://lnkd.in/gYB4Dw4K
Tags:
You May Also Like

-
Dec 24, 2025
The PMBOK® Guide (Project Management Body of Knowledge) published by the Project Management Institute (PMI®) is the global standard for...

-
Dec 23, 2025
Project management is not a one-size-fits-all discipline. Different projects require different approaches depending on scope, complexity, uncertainty, and stakeholder expectations....

-
Dec 22, 2025
Scope creep is one of the most common reasons projects fail—even when teams are skilled and plans are well prepared....

-
Dec 19, 2025
In today’s fast-changing business environment, delivering value quickly is more important than delivering everything at once. This is where MVP...
Sign up to receive our latest updates
Company
Support
Service Offerings
Special Offers
Get in touch
India
Call us directly?
+91-984-459-1589
Address
Learnerskart Solutions Pvt Ltd
4th floor, No: 207/189, 9th Main Rd, 6th Sector,
HSR Layout, Bengaluru, Karnataka 560102
info@learnerskart.com
USA
Call us directly?
+1 (307)-998-3816
Address
Learnerskart Americas LLC
30 N Gould St Ste R
Sheridan, WY 82801
info@learnerskart.com
Quick Contact
Trending Categories
Disclaimer
“PMI®”, “PMBOK®”, “PMP®”, “CAPM®” and “PMI-ACP®” are registered marks of the Project Management Institute, Inc.
ITIL® and PRINCE2® are registered trade marks of AXELOS Limited, used under permission of AXELOS Limited. All rights reserved.
“CSM”, “CST” are Registered Trade Marks of The Scrum Alliance, USA.