S-Curve in Project Management: A Complete Guide for Project Managers
-
December 16, 2025
Managing a project effectively requires clear visibility into how work, cost, and time progress throughout the project lifecycle. One of the most reliable tools to track this progress is the S-Curve—a simple yet powerful graphical representation used across industries, including construction, IT, engineering, manufacturing, and product development.
In this guide, we break down what an S-Curve is, why it matters, how it is used, and how project managers can leverage it for smarter decision-making.
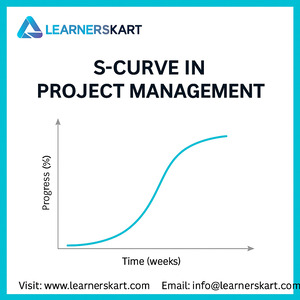
What Is an S-Curve in Project Management?
An S-Curve is a chart that visually represents cumulative progress plotted against time. When displayed, the curve typically forms the shape of the letter “S,” starting slow, rising rapidly, and then flattening toward the end.
The S-Curve helps project managers compare:
-
Planned vs. Actual Progress
-
Planned vs. Actual Cost
-
Resource Utilization
-
Earned Value Metrics
-
Overall Performance Trends
Because projects rarely progress at a constant pace, the S-Curve provides a realistic picture of how the work unfolds over time.
Why Is It Called an “S” Curve?
The curve resembles an “S” due to the natural flow of project execution:
1. Slow Start – Initiation & Planning Phase
Project activities begin gradually due to planning, approvals, mobilization, and resource allocation.
2. Rapid Growth – Execution Phase
This is where the bulk of the work happens. Productivity peaks, budgets are utilized, and progress accelerates rapidly.
3. Slow Finish – Closing Phase
As project tasks conclude, the pace slows again due to testing, reviews, quality checks, and final documentation.
This pattern creates the characteristic S-shape, making it easy to track whether a project is moving as expected.
Types of S-Curves Used in Project Management
Understanding different S-Curve types helps project managers analyze performance from multiple angles.
1. Baseline S-Curve
Represents the planned progress across the project timeline.
2. Actual S-Curve
Shows real performance achieved to date.
3. Target S-Curve
Used for revised schedules or mid-project corrections.
4. Expense/Cost S-Curve
Tracks the cost accumulation over time.
5. Manpower/Resource S-Curve
Shows resource loading and utilization patterns.
6. Earned Value S-Curve
Used to compare PV (Planned Value), EV (Earned Value), and AC (Actual Cost).
How S-Curves Are Used in Project Management
✔ Schedule Tracking
Helps identify if the project is ahead or behind schedule.
✔ Cost Monitoring
Shows whether actual expenses align with the budget.
✔ Performance Forecasting
Predicts future progress, delays, and cost overruns.
✔ Productivity Analysis
Helps managers understand peak activity periods.
✔ Decision Making & Corrective Actions
Early deviations can be spotted and corrected with data-driven decisions.
✔ Stakeholder Communication
S-curves offer a simple visualization that executives, clients, and team members easily understand.
S-Curve Example: Planned vs. Actual Performance
A typical S-Curve comparison might show:
-
Planned Curve: Ideal expected progress
-
Actual Curve: Real progress recorded
-
If the actual curve falls below the planned curve → the project is behind schedule
-
If the actual curve rises above → the project is ahead of schedule
Such visual comparisons quickly highlight performance gaps.
Benefits of Using S-Curves in Projects
-
Provides clear visibility over the project lifecycle
-
Supports Earned Value Management (EVM)
-
Helps track cost performance more accurately
-
Enables better risk detection and mitigation
-
Improves reporting and stakeholder alignment
-
Offers a realistic, data-driven project overview
Limitations of S-Curves
Even though S-curves are powerful, they have limitations:
-
Not suitable for extremely dynamic or rapidly changing projects
-
Accuracy depends on the quality of baseline data
-
Requires consistent progress tracking
-
Cannot explain root cause—only shows deviation
However, when combined with EVM, variance analysis, and schedule reporting, S-Curves provide exceptional control.
Conclusion
The S-Curve is a vital project management tool that provides project managers with in-depth insights into cost, schedule, and performance trends. Whether you’re tracking budget, forecasting progress, or monitoring productivity, S-Curves provide a reliable foundation for data-driven decision-making.
For PMP aspirants, understanding S-curves is especially critical, as they form part of the Schedule Management, Cost Management, and Earned Value Management topics tested in the exam.
When used correctly, S-Curves can transform project visibility and ensure your project stays on track, on schedule, and within budget.
📞 Learnerskart Contact Details
🌐 Visit: www.learnerskart.com | 📧 Email: info@learnerskart.com
✔️ Follow us for more project management tips & career insights! https://lnkd.in/gYB4Dw4K
Tags:
You May Also Like

-
Feb 16, 2026
If you’re planning to apply for the PMP certification in 2026, one important question comes first: “Am I really eligible...

-
Feb 13, 2026
In today’s fast-paced business environment, choosing the right project delivery approach can determine whether your project succeeds or struggles. Organisations...

-
Feb 10, 2026
In today’s fast-paced and increasingly complex business environment, organisations are no longer managing just one or two initiatives at a...

-
Feb 9, 2026
In project management, confusion over who does what and who makes the final decision is one of the biggest reasons...
Sign up to receive our latest updates
Company
Support
Service Offerings
Special Offers
Get in touch
India
Call us directly?
+91-984-459-1589
Address
Learnerskart Solutions Pvt Ltd
4th floor, No: 207/189, 9th Main Rd, 6th Sector,
HSR Layout, Bengaluru, Karnataka 560102
info@learnerskart.com
USA
Call us directly?
+1 (307)-998-3816
Address
Learnerskart Americas LLC
30 N Gould St Ste R
Sheridan, WY 82801
info@learnerskart.com
Quick Contact
Trending Categories
Disclaimer
“PMI®”, “PMBOK®”, “PMP®”, “CAPM®” and “PMI-ACP®” are registered marks of the Project Management Institute, Inc.
ITIL® and PRINCE2® are registered trade marks of AXELOS Limited, used under permission of AXELOS Limited. All rights reserved.
“CSM”, “CST” are Registered Trade Marks of The Scrum Alliance, USA.